![]()
AIR TOXIC EMISSIONS AND HEALTH
Air Pollution in the Sydney Basin - Sources, Cycles and Health Impacts
![]()
Sydney's Daily Smog Cycle
The cartoon strip below shows the key steps in
the process that pumps and concentrates pollution and adverse
health impacts in Sydney's West and South West. Options for airport
expansion are discussed in this context.
Click on an image to step forward through the Daily Cycle. Use browser back button to Step Backward. Start by clicking here. Best viewed at 1024 x 768 resolution or better, 32 bit colour, and browser window maximised (the graphics below are 510 pixels wide, and browser needs to be able to show over 700 pixels width - there are notes down the right hand side of the page). Tested with IE 5.1 and 6.0. Each image is between 100 K and 120 K bytes in size, and may take a little while to download on a 56K link. Printing is best attempted with IE 6.0 or later (pagination is handled better in IE6). First published July 2001, Last revised
Last Change: vdeck mod
Visitor
since Sat 21-Feb-2004.
Sydney Second Airport - The God's Must be Crazy | References/Links
|
|
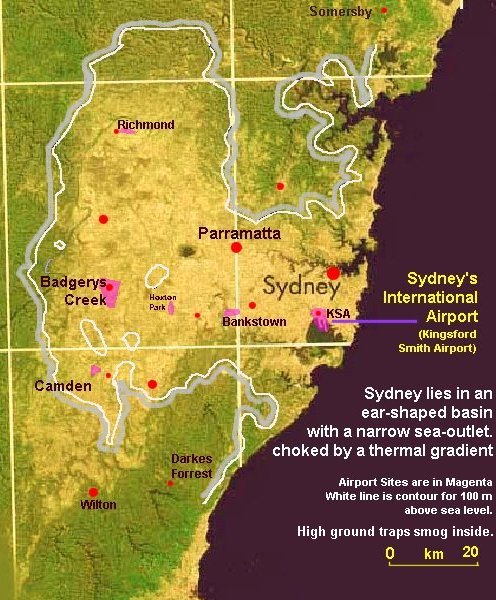 |
Figure 1 - Sydney Basin Smog Boundary
100m contour is indicative only of
the smog boundary. Pollution slops around in the basin and impacts
a wider area.
|
|
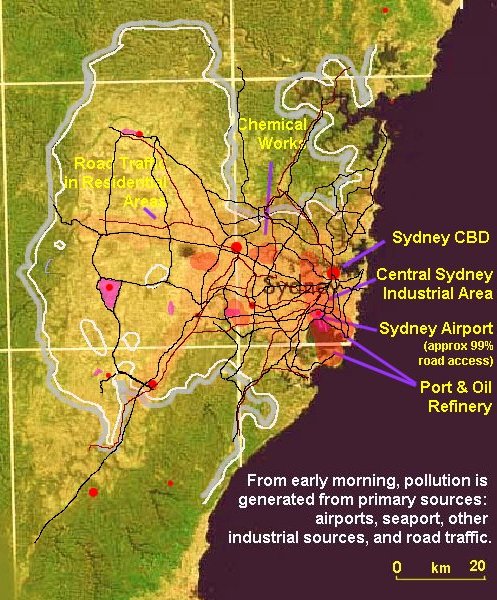
Figure 2 - Morning Smog Sources
Lighter red shading represents developed
residential areas. Large areas in the west are semi-rural still,
including a 10 km buffer zone around the Badgery's Creek site
Black lines are motorways, freeways and major roads. Brown lines are rail lines. |
|
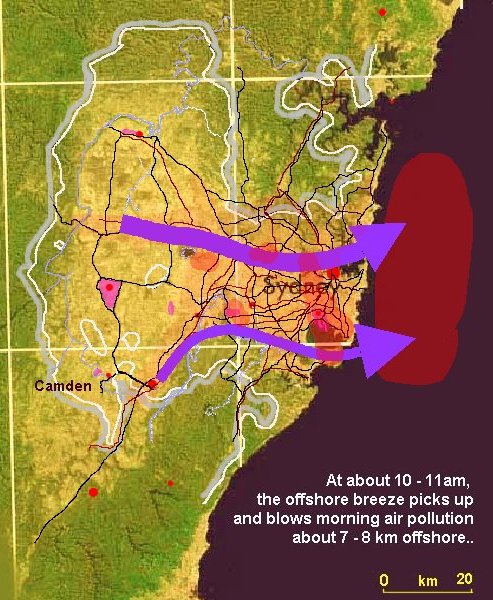
Figure 3 - Morning Cold Land Breezes take
Pollution off-shore - Priming Pump
During the night, cold air accumulates on
the Tablelands south of Lake Burrogorang (Warragamba Dam), then in
the early morning flows down the ridge between Mittagong and the
Illawarra Scarp (the South Westerly-Regional Flow identified by
Hyde) - injecting a South-Westerly flow into the Sydney Basin -
through the upper reaches of the Nepean River, the South Creek
Valley, and the Georges River Valley.
Similarly, cold air accumulated on the Blue Mountains west of Richmond flows down into the Richmond area, and passes east along the Hawkesbury River Valley and spills over into the Parramatta River Valley around Blacktown. |
|
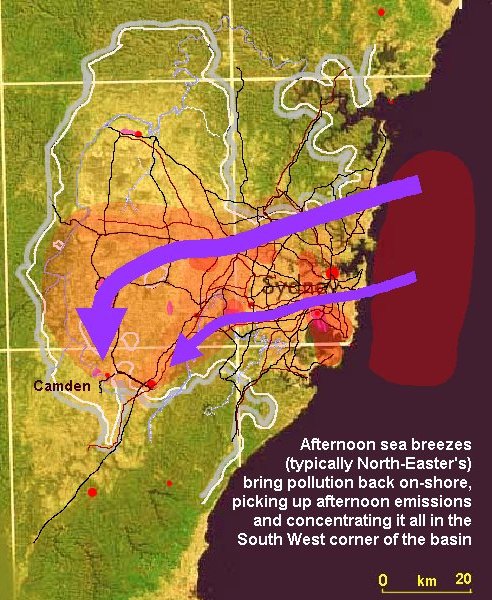
Figure 4 - Breezes turn-around Mid Afternoon -
Smog Pumped inland by onshore Sea Breeze
For more information on Sydney's Sea
Breezes see Sea Breezes on the
Sydney Coast(Bureau of Meterology site)..
Evidence of sea breezes in last 72 hours can also be found at Bureau of Meterology Observations for NSW site - follow link Hourly Data from NSW AWS then click on a site to get last 72 hours data. |
|
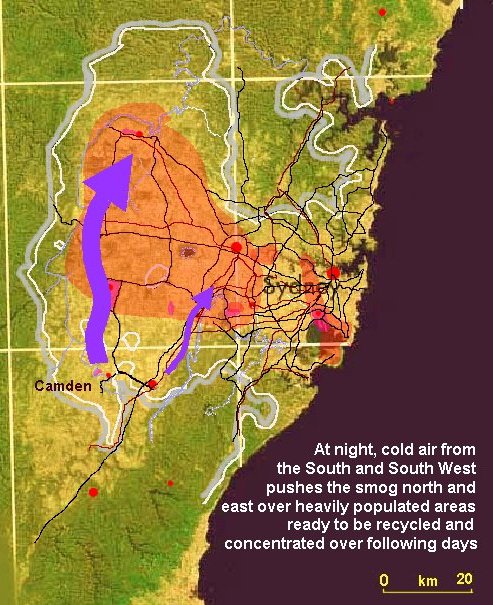
Figure 5 - At Night, Cool flow from South Pushes
Smog North and East
|
|
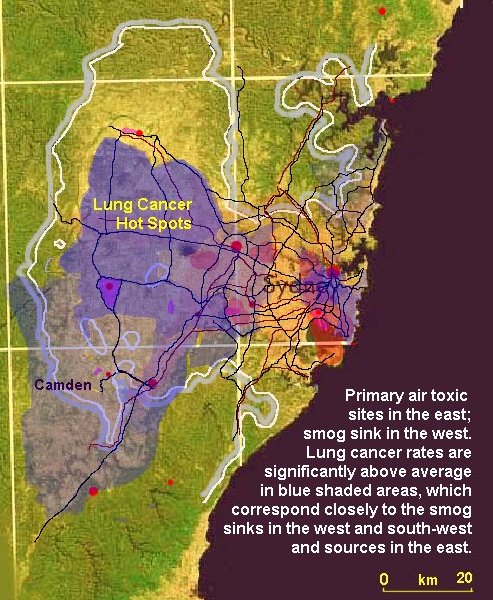
Figure 6 - Lung Cancer Hotspots - Matches Smog
Clouds
Blue shading represent local government
areas (LGA's) where rates of lung cancer are significantly higher
than state averages. Compiled by superimposing Cancer Council's map
for male and female cancer rates . Darker blue shading represents
signficantly higher than average rates; lighter intensity blue are
higher than average rates.
|
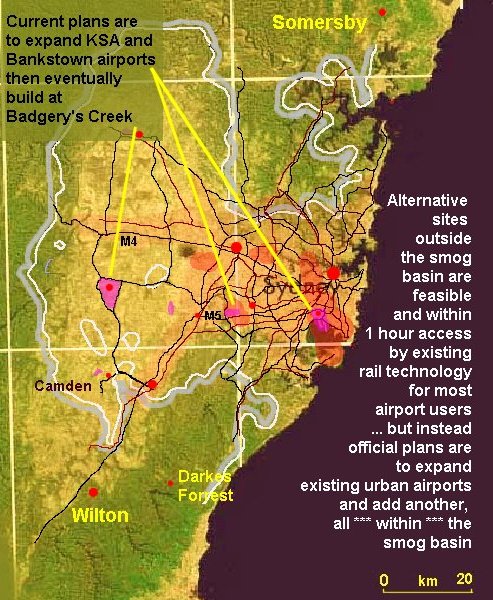 |
Figure 7 - Out of Basin Options
Click here to
return to Figure 1
|
Sydney's Airports and Smog PumpsIn most countries, airports are exempt from air pollution monitoring and regulatory laws (have you heard of lead-free Avgas yet ? ). Yet they are often the largest single point source of pollution in a city. Jannette Barros shows how Sydney is built in a topographical basin which traps pollution for Sydney Airport and demonstrates the already considerable adverse health impacts attributable to air pollution in the Sydney Basin.... As we enter the new millennium, Australian planning is moving further away from delivering sustainable airport developments for the Sydney region. Sydney Airport is adjacent to the Central Sydney Industrial Area, Port Botany and an oil refinery. In suburbs surrounding these facilities there is anecdotal evidence for higher than usual incidence of certain cancers and respiratory disease. Daily Pollution CycleThe figures above show the typical daily cycle of air pollution in the Sydney basin. The Sydney basin is a classic "closed" basin, bounded by high ground to the south, west and north, and by the temperature differential between land and ocean on the eastern side. Trapped pollution may accumulate and circulate inside the basin for several days [1, 2], exacerbated by relatively frequent temperature inversions. Sydney's highest lung cancer occurrences are found at the primary pollution sources in the eastern part of the basin and in the western Sydney basin pollution sink area. Higher than NSW State average lung cancer patterns shown in dark blue on the Figure 6 above are sourced from NSW Cancer Council [3] Cancer Council statistics were compiled on the
basis of totals for local-government areas until 2003. Large parts
of the Western end of the basin are still sparsely populated (see
map
for urban development). The NSW government plans 1.3 million more
people for the area, mainly North of the M4 and in the
Campbelltown-Camden corridor.
The cancer occurrence patterns cannot be simply explained away by tobacco usage. It is logical to conclude that smokers living in areas of high air pollution attract a higher risk of lung disease than smokers living in cleaner air environments. And the same is true of non-smokers. The patterns indicate that Sydney is experiencing a significant number of certain types of cancers representing calculable costs. The average direct cost for treating a cancer case over time is A$100,000 and rising [4]. Areas of above-average lung cancer occurrences in Sydney (see Figure 6 above) show striking similarities to the patterns of high cancer risk associated with major US airports at Minneapolis St Paul [5], Seattle [6] and Chicago [7] which in turn support the results of overseas studies. [8, 9]. See also the Sierra Club Cancer Pollution Report for more information on the link between cancer and pollution. Cars - Benzene and ParticulatesIt is relevant to note that in car-dependent Sydney, public transport is regularly neglected in favour of building more roads. The legal maximum for benzene in Australian petrol (leaded and unleaded) is still 5%, whereas most European countries now allow only 1%. It is believed that the Australian level of benzene may be around 2-3% in both leaded and unleaded. Health warning labels should be compulsory on all petrol bowzers to inform people about the contents of fuel at self-service stations { Ed.- benzene is a
well-proven carcinogen, More hazardous than most chemicals in 5 out
of 14 ranking systems. Ranked as one of the most hazardous
compounds (worst 10%) to ecosystems and human health (see
Benzene Hazard - www.scorecard.org ).}
Where PM2.5 particles descend through a polluted urban air column, it is suspected that they may "piggyback" carcinogens, which may be breathed deep into human lung tissue, beyond the lungs' ability to expel them, becoming potential tumours. Negative health implications for children of exposure to air toxics has been summarised by NRDC [10]. Negative health implications from diesel fumes are well known, and summarised recently by Dr Peter Fisher, of Gladstone University, Qld. [11] In addition to cancer, premature mortalities from particulates are in the order of 400 per annum [12], and asthma is also common in Sydney. More than 95% of all access to and from Sydney airport is by road, making it far from world's best practice. Thus, airport-related road traffic emissions must never be excluded from total airport emissions calculations. In Sydney, the numbers, average size, weight and age of motor vehicles is rising, outstripping gains made by improvements in fuel quality [13]. Similarly, aircraft numbers have risen fast, older aircraft have been kept in service longer than originally intended, outstripping gains made by reductions in aircraft engine noise. [14] Air pollution 'bigger killer than road accidents'
Air pollution 'bigger killer than road accidents'
March 2, 2004
Sydney Morning Herald Air pollution was responsible for more deaths among Australians than road accidents, the nation's leading science body said today. "Mortality due to air pollution in Australia is higher than the road toll," CSIRO Atmospheric Research scientist Tom Beer said in a statement. "Each year, on average, 2,400 of the 140,000 Australian deaths are linked to air quality and health issues - much more than the 1,700 people who die on our roads. "That's an average of a death every four hours. This number increases if long-term effects of air toxics on cancer are included." Dr Beer is one of the organisers of a forum in Melbourne starting today for scientists, medical researchers and government agency representatives considering the issue of air quality.
The link between mortality and air particulate pollution is also very quantitatively described in the Medical Journal of Australia (MJA 1998; 169: 452-453) - see
Something particular in the air we breathe?
Government Turns a Blind EyeGovernment studies of health impacts of air pollution have been limited to the effects of carbon monoxide, nitrogen dioxide, ozone, sulphur dioxide, lead and particulates. Specific known carcinogens and toxics related to total airport operations, such as benzene, 1,3 butadiene, formaldehyde, etc., have never been measured nor their health implications assessed for Sydney Airport. Despite this, SACL recently made the startlingly ingenuous claim that emissions from the airport have not increased significantly since 1992 (despite there having been a one-third increase in aircraft traffic and subsequently an even greater increase in motor vehicle traffic to and from the airport). SACL claimed that the emissions measured at their 2 monitors -- one at the airport and one at Botany) do not represent a significant health risk to surrounding residents [15]. One possible explanation -- SACL’s monitors not turned on? The Value of HealthTo date there has been no cost/benefit analysis of the comparative value of within-the-city airports against the value of a healthy and productive population. One possible reason why ill health is discounted by economic rationalist transport planners, and in effect encouraged, stems from the daft practice of counting health costs as contributing positively to economic growth (Ed.: for example, economists count smoking as
contributing positively to economic growth - the cost of cancer
treatment for smokers is counted as a productivity plus, and even
their premature death relieves the drain on old age
pensions).
There is a clear need to distinguish "good" from "bad" economic growth. But, just like the tobacco industry has not avoided having to compensate smokers, the aviation industry cannot expect to be exempted forever from taking fiscal responsibility for the toll urban airports inflict on human health and well-being. Big City KillerIf the cigarettes don't get you the traffic pollution will UP TO a fifth of all lung cancer deaths in cities are caused by tiny particles of pollution, most of them from vehicle exhausts. That's the conclusion of the biggest study into city pollution to date, which tracked half a million Americans for 16 years. It suggests the impact is far greater than feared. The study is important because it followed individuals, says British expert Roy Harrison of the University of Birmingham, allowing the researchers to separate the effects of smoking and pollution. "In the past, we have often just compared urban areas and rural areas. But more people smoke in cities, and it is difficult to compensate for that." The research focused on particles less than 2.5 micrometres in diameter, known as PM2.5s. These fine particles are thought to kill by lodging deep in the lungs. The researchers found that the long-term death rate from lung cancer rose by 8 per cent for every 10-microgram increase in the average concentration of PM2.5s per cubic metre. The increased risk is comparable with the risks to long-term passive smokers. Typical PM2.5 levels in the US are 20 micrograms in Los Angeles and 16 micrograms in New York-the limit set in 1997 by the Environmental Protection Agency is 15 micrograms. British levels are similar, though one PM2.5 monitor at Marylebone Road in London records an average of 32 micrograms. "I'd say London has a special problem because of the high proportion of diesel fumes," says George Thurston of New York University, co-leader of the study. The implications are bleakest for developing countries. In heavily polluted cities such as Beijing or Delhi, particulate levels average over 300 micrograms and most of this is probably PM2.5s.
More at: The Journal of the American Medical Association (vol
287, p 1132)
From New Scientist 09 March 2002.
REFERENCES
Airport Environmental Capacity ConstraintsAs extracted from the Airports Council International site, June 2001: Present indications suggest that the phase-out
of Chapter 2 aircraft by 2002 will not alleviate the noise problem
as effectively as was once thought. As air traffic increases,
overall aircraft noise levels around airports are expected to rise
some time after 2002. ACI's goal is to ensure that traffic growth
can be maintained within the environmental capacity limitations
imposed upon airports by governments. These limits may be set lower
than the current capacity of airports. Future traffic growth will
only be possible if noise and emissions are reduced at the source.
The industry cannot wait! More stringent noise and emissions
certification standards have to be achieved in order to encourage
manufacturers and airlines to produce and operate quieter and
cleaner aircraft.
Sea Breeze: A local onshore wind. Cooler air from over the
sea flows onto the shore to replace the warm air rising over the
land. On sunny days the land heats up more quickly, and to a
greater extent, than the sea. The air in contact with the land
warms and expands and the resulting changes in the pressure and
temperature differences and distributions cause the sea breeze
circulation. At night, when the land cools more quickly, and to a
greater extent, than the sea, the reverse land breeze circulation
is set up.
|