Forecasting Growth
When the Australian Government announced (Jan 1996)
investigation of Holsworthy Military Training Reserve as a second
site for Sydney's second airport, there was a sudden jump in the
forecast load on the airport from 25 million to 30 million
passengers per year (in barely six months). Why the jump ?
"All the statistical analysis, the surveys,
the expenditure forecasting, the projected growth of demand - these
did not lead to the choice at all: they were initiated and selected
in order to bolster it up afterwards"
- Antony Jay, author of the popular BBC
television series "Yes Minister", in "Householder's Guide to
Community Defence Against Bureaucratic Aggression"
It's possible that this inflated figure was to be used to rule
out Badgery's Creek, the site planned since 1984 with a forecast of
25 million passengers per year underpinning it. So let's see
how good the new number is.
January 1996 Air Traffic Forecasts by the Department of
Transport claimed that the number of passenger's using KSA each
year has grown at 6.9% for the past 30 years, and predict Sydney
will have 60 million passengers arriving at its airports in 2025
(originally published at
"http://www.dot.gov.au/programs/avpol/avstats/sydbasin.htm")
"If a guy tells me the probability of failure is 1 in 10E5, I
know he's full of crap."
- Richard P. Feynmann, Physicist, in What Do
You Care What Other People Think?
The 60 million figure comes from a simple model of exponential
growth. Exponential growth works just like interest growing on a
loan with no payments. The graph here shows how exponential growth
fits the historical data (see the line labeled Best Exp Fit 1997).
This actually has a growth rate of 5.9% pa - lower than the DOT's
original proposal 7% forecast; the 5.9% figure comes from a more
statistically valid regression analysis. It's a fair fit to the
historical record. But it's hardly a perfect fit to the bumpy
actual data - there's plenty of gaps there.
Figure 1 - Forecast Model Comparison
Also shown in the graph are some alternative models. The Draft
EIS prediction from the DOT (late 1997) has been included, as has
been the Final EIS revised predictions from July 1999.
The magenta line labelled 1997 Logistic shows a mathematical
model of logistic growth, using just the data points available in
early 1997.
While there's not much difference in the historical fit, the
picture soon changes a little when you project into the future.
The DOT's model is simple in that it assumes the population of
travelers will grow without end - if you let it run on (this is
shown in the next graph below). This is like expecting VCR, car
sales or mobile phone sales to grow without end. Or for a
population of rabbits to grow without end.
 In reality, this
never happens. Every market or environment will eventually
"saturate" (and interestingly, for many technologies, this occurs
over about 30 years - or one generation - just about the time we've
had cheap 747 based air travel technology). For natural
populations, competition for scarce food increase the death rate as
the population grows. For technologies, competing products are
developed at an increasing rate as the market grows.
In reality, this
never happens. Every market or environment will eventually
"saturate" (and interestingly, for many technologies, this occurs
over about 30 years - or one generation - just about the time we've
had cheap 747 based air travel technology). For natural
populations, competition for scarce food increase the death rate as
the population grows. For technologies, competing products are
developed at an increasing rate as the market grows.
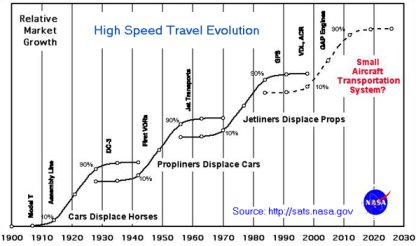
NASA's SATS 1999 research supports this (presented two years
after BEAR advocated logistic curve modelling; click on NASA graph
to learn more about SATS).
Even if air travel becomes cheaper, there's a limit to how many
times you'll want to go to Paris in one year (Been there, done
that!). If you're going to Sydney for an Olympic holiday in year
2000, you might not take your usual visit in 1999 or 2001.
In the logistic growth model, both
the initial exponential growth and its slow-down due to limits
being reached are modelled This is clearer when you look at the
next 30 years in the Projected Movements graph.
Future Growth of Sydney Airport Needs
This graph also shows the trend from the DOT's forecast for the
next 30 years. Interestingly, although they've stuck by their
exponential growth model, they've not chosen to use their
historical growth rate (6.9%) for the next 30 years. Why ?
Could it be that it gave the wrong answer ? If you accepted it's
prediction of 110 million passengers per year, you'd really have to
start talking of lots more than a second airport - at a time when
talk of a 2nd airport scares the hell out of most of
us.
So what did they do ? They didn't throw away their simple model
- even when they suspect it's wrong. Rather, they've gathered a few
of their mates around a table, and cooked up 3 lower exponential
growth estimates - 6.1% to 2000, 4.6% to 2010, and 3% to 2025 (this
was the 1997 Draft EIS forecast). Why 2000, 2010 & 2025 ? Is
something special due to happen then ? Not !
This looks dreadfully like they worked back from a target of 60
million passengers per year. Such a figure (if true) would "prove"
that KSA remains viable at its present capacity, and a
2nd airport with double KSA's capacity would nicely
handle the rest. Or alternatively, grow KSA by 50%, and have two 30
million passenger airports. This might be the sort of evidence you
need to maximise your return on the sale of KSA, but is clearly not
objective value-free science
For the Final Supplement to the EIS (see Section 4.3.3, page
4-5), the DOT revised it's optimistic forecast further to better
match what had come to pass over the 1997-1998 year. They fudged
the figures down a little to 4.0% growth to 2000 (down 2%), 4.2%
until 2010 (down by 0.4%), and 2.8% (down by 0.2%) to 2020 (not
2025 as previously). Once again there was no public scrutiny of the
forecast process. And there is no explanation of why the forecast
period has been truncated to 2020. Are they losing confidence in
their forecasting ability ?
The DOT's downward revision of the exponential growth rate seems
to acknowledge that there are limits to growth. Can we do better
with a more realistic logistic model that accounts for competition
and market saturation effects ?
Looking at the lower (1997) Logistic Growth curve in the second
graph above, you can see it begins to flatten out. It suggests that
we'll need airports to handle only 37 million passengers per year
in 2025 - not quite double what KSA does now.
The 1997 logistic growth model matches very closely with the
historical record. Note that if you were less careful about the
historical fit, you could show lower future growth scenarios (some
even as low at 30 mpy for 2025).
Extraordinarily, SACL's 2003 Masterplan for KSA has stuck with
the 64 million passenger movements plus target for 2025. That's in
spite of the very heavy down-turn in aviation due to SARS, Sept 11,
the Bali bombing etc.,. etc.,. Since they've passed the DOT's
breakpoints in the curve, SACL's is a simple 4.2% pa growth
exponential curve. Wishful thinking !! Maybe they hope the
share-market isn't smart enough to doubt it.
In case you're getting the idea that numbers can be produced to
fit any argument, you're learning -let's take a reality check. The
real value of the numbers is only known when the passage of time
provides new data to check the model with.
The proof of any forecasting model is in how well it predicts
the future. So how does the logistic model, based on data available
up til 1997, do at predicting the following two years of data (1998
and 1999) ? Take a close look at the top graph above.
The Final EIS provides an additional data point for 1997-98
passenger movements of 21.3 million. This matches the logistic
curve prediction of 21.23 million for 1998 well - and better than
both the Draft EIS DOT forecast of 22.72 million and it's earlier
23.1 million forecast. It provides strong substantiation of the
arguments constructed here in 1997 (before the 1997/98 data point
was available).
The SACL 1999 Annual Report gives another data point - 21.88
million passenger movements for 1999. Again, the logistic curve
prediction of 22.5million is closer than the Draft EIS forecast of
24.11 million and the earlier 24.7 million forecast.
So for the first two years of its "future", the logistic model
(based on data to 1996/97) produced better results than the
exponential models used by the airport proponents. When 99/00 data
is included, the score is 3-0 to the logistic model (see Updated Airport Growth for Sydney
Airports for more details, including data points for
2001/2002).
The logistic equation prediction is
better science whereas the DOT's methods appeal to
guesswork.
It is sensible to ask whether their guesswork could be wrong.
The logistic estimate shows that if the past is like the future,
the EIS forecasts may be too low. On the other hand, there are new
factors like future oil prices and lower population growth rates
than in the past that might mean even the DOT's forecasts are too
high.
In fact, the Australian Bureau of Statistics predicts (2000) that Australia's
population will grow to around 24 million by 2025 (growing from
around 1.0% per annum in 2000, and with no or negative growth
beyond 2021). With Australia's population at 19 million (18.7 m in
June 98), Sydney Airport gets around 20 million passengers per year
(or one in five of Sydney's 4 million people move through the
airport, or one in ten making a return trip once a year).
To expect nearly 75 million passenger movements from an
Australia of 23 million (in 2025) implies over 15 movements per
Sydney-sider each year (Sydney will have around 4.8 million
people). With the sinking Aussie dollar, there are likely to be
fewer Sydney people able to afford overseas travel - so do we have
to hope that there will be such a massive increase in tourists
coming here ? It seems very fanciful thinking.
By November 17th 2000, Qantas CEO Margaret Jackson reported to
shareholders (at their AGM) that fuel costs are set to rise
"Excluding movements in foreign exchange and increases in fuel
usage from new flying, fuel costs will still be more than $170
million higher than last year". In the year to June 30, Qantas'
fuel and oil costs rose 13% to $863.2 million, or 10% of total
costs. The rise contributed to a 7 per cent lift in costs. With the
Australian dollar losing 13% against the $US since June 30,
aviation gasoline costs could rise by up to 20 per cent, topping $1
billion.
So far this year, jet fuel prices have risen by as much as 57
per cent, prompted by strong demand as winter chills hit the
northern hemisphere. According to the International Air Transport
Association, fuel costs are now 18% of airline costs, up from 12%
two years ago. Ms Jackson warned investors that interim operating
profit was unlikely to differ from the previous corresponding
period.
The following day Qantas' share price fell 20c to $3.30 - down
more than 5% for the day and on their lowest close since June. The
days of strong growth may be near their end...
But this doesn't mean the DOT numbers are meaningless - they do
show the dangers we are in.
Risks of a Second Airport
-
Firstly, there's a possibility the Second Airport will be one
huge white elephant. At the
extreme, airport traffic may fail to grow and no new airport would
be necessary (e.g. if oil supplies peter out - see The End of Cheap Oil
or Scientific American, March 1998 or for Jean Laherrere's analysis of
oil supplies at http://www.oilcrisis.com/laherrere or look for
the International
Energy Agency's paper for the March 98 G8 Energy Minister's
meeting, http://www.iea.org/g8/world/oilsup.htm ).
-
While this will be good for the victims of the airports flight
paths and vehicular traffic, it won't be good for whoever paid for
the airport - and in all likelihood this will be the taxpayer or
travelers who underwrite or fund the private airport
developer..
-
On the other hand, there is a possibility that the planned
airport will be grossly inadequate
- and Sydney should be planning BOTH Holsworthy and
Badgery's Creek Airports plus a trebling of KSA now.
There's a serious risk that the private airport owner will sue
the government when he can't make enough profit because the
forecasts were wrong (too high or low). Guess who'll foot the bill
then ?
It is the mark of an educated mind to rest satisfied with the
degree of precision which the nature of the subject admits and not
to seek exactness where only an approximation is possible.
--Aristotle
Naturally, the DOT's traffic forecasts make no mention of the
risks of these errors. They've buried them in a morass of
pseudo-scientific fudgery and econometric mumbo-jumbo. And they're
hoping we'll be bamboozled into accepting this.
Write and tell them they've failed. Demand that they properly
identify the risk's that the forecasts are wrong and that they
consider more appropriate models. Better still, tell them to get
out of the business and let the private sector do its own dirty
work of justifying a new airport - EIS & all !
Originally prepared August 1997,
Last Revised
p>
Last Change: vdeck mod
Visitor
since Sat 21-Feb-2004.